|
In previous posts I laid out five (plus/minus one or two) easy* steps for developing a scientific presentation. For today's post I'll be going into more detail about the preliminary work that you should do before you set off on making a perfect** presentation. As an added bonus, you'll get a sneak-preview of my presentation at the upcoming Society of Environmental Toxicology and Chemistry (SETAC) North American annual meeting located in the ever chic and always stylish capital of Utah, Salt Lake City. So not only do I get a blog post from my efforts, I'll have already put some time and effort into my talk before I get to the meeting. That's what we call in science a win-win situation, and in my case even better than free pizza at a seminar you were already actually planning on going to.
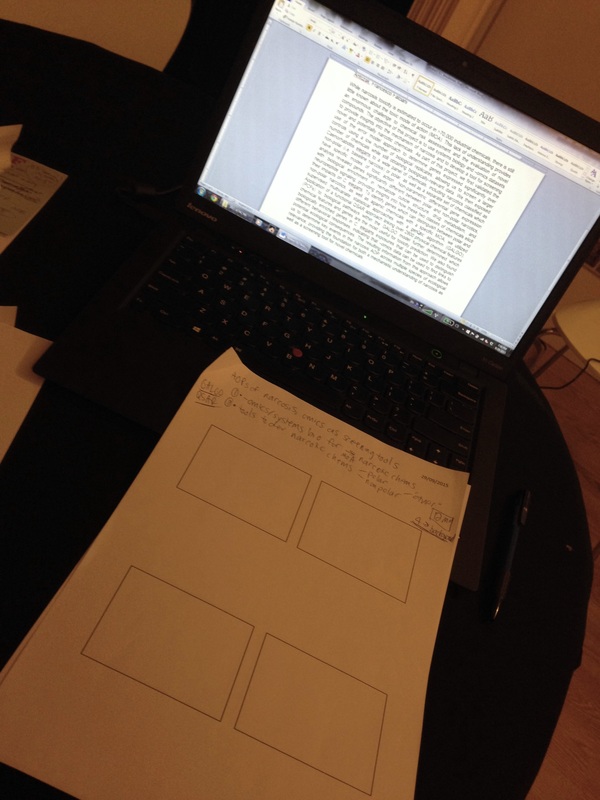
*Easy: Remember that nothing good in life comes that easy, as evidenced by the fact that I spend 3 hours making 4 slides for this talk. **Perfect: In the end I'll probably end up getting nervous and making a sarcastic comment about how my bipolar membranes look like lollipops, but that's OK, because the story is what’s important and the story is what they’ll remember. Step 0. Make a story board For my SETAC presentation, I get 12 minutes for the talk and 3 minutes for questions and answers. Following the presentation rule of thirds means the first 1/3 is background/broad appeal, the second 1/3 is in-depth details and concepts for people in my field, and the last 1/3 is my novel contribution to the field. Because of this, I printed out blank Powerpoint slides in groups of four. I'll focus on having 4 minutes of background information/introduction, 4 minutes of detail-oriented methods and ideas relevant for my results, and 4 minutes of my actual results. It may sound like a small amount of data, but having given a good overview of the big picture of my project, as well as a bit more in-depth review of relevant methods will make the data I show more clear and understandable, and therefore more memorable.
With my storyboard printed and ready to go, I started off by going back to the original conference abstract to make sure I set off to present what I said I was going to present. I started with putting two things in my mind: the objective of the work to present in my talk and my audience. Writing down your objective again before starting on slides helps focus your mind on the bigger picture of what you want to present. In my case, the objective of the data for my talk is focused on the molecular mechanisms of narcosis toxicity and developing new screening tools for different classes of narcotic chemicals (as part of my post-doc project with Unilever). My audience in this case is one I know quite well: SETAC regulars who will be coming to the session on '-Omics technologies and their real-world applications.' There will be quite a few people in this audience that I'll know personally, and others whose work I'll be mentioning in my slides. No pressure!
With my audience and objective laid out, I set to work on the slides. Following the rule of thirds, I started off with background information/broad appeal, to get everyone on the same page. While most of this audience will know about concepts like gene expression, risk assessment, and adverse outcome pathways, I want to make sure that someone popping over from an environmental chemistry session will also be able to follow along. At the same time my subject area is not one of the hotter topics at SETAC, so a bit of background in terms of biology and relevance is necessary here.
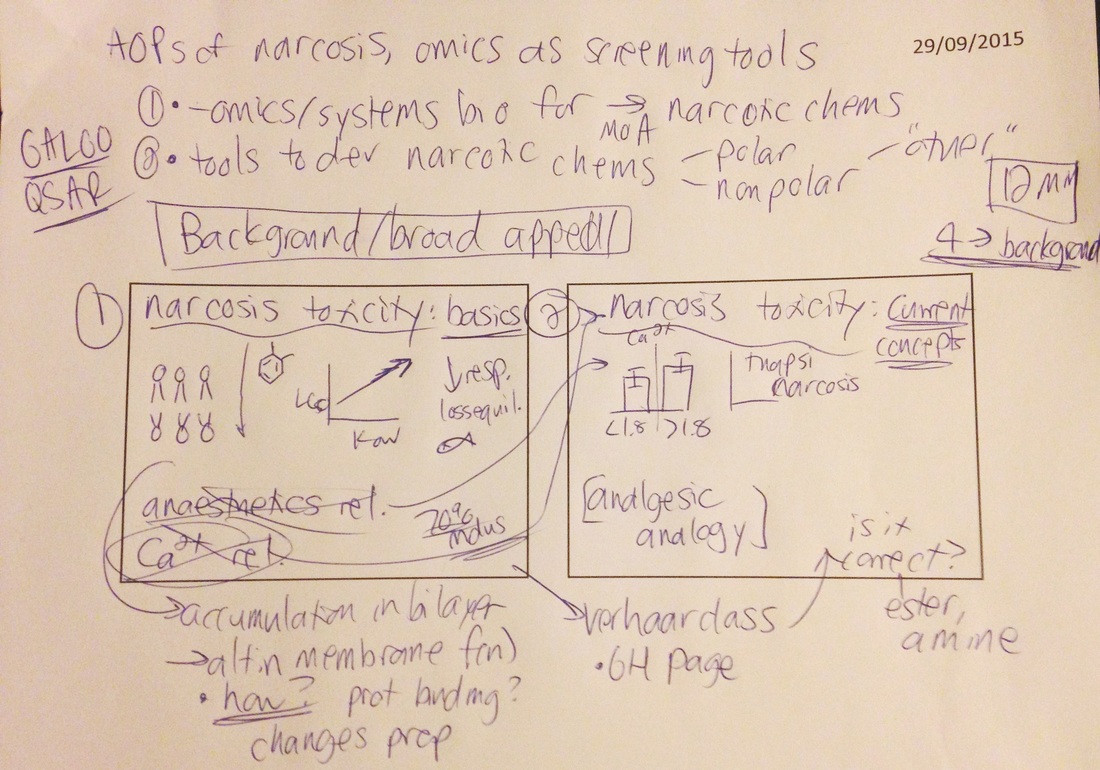
I decided to start off my talk with a description of narcosis toxicity. As I said, this isn't a hugely hot topic in my field, so I planned on making the first two slides as an opportunity to teach anyone in the audience who hasn't heard it much before. I split this into two parts, one focusing on the basics/textbook toxicology concepts of narcosis, and the second going into more details on recent papers and new understandings. Here I also sketched out what to put on each slide, including my lollipop-esque membranes, and what figures from the literature I wanted to include.
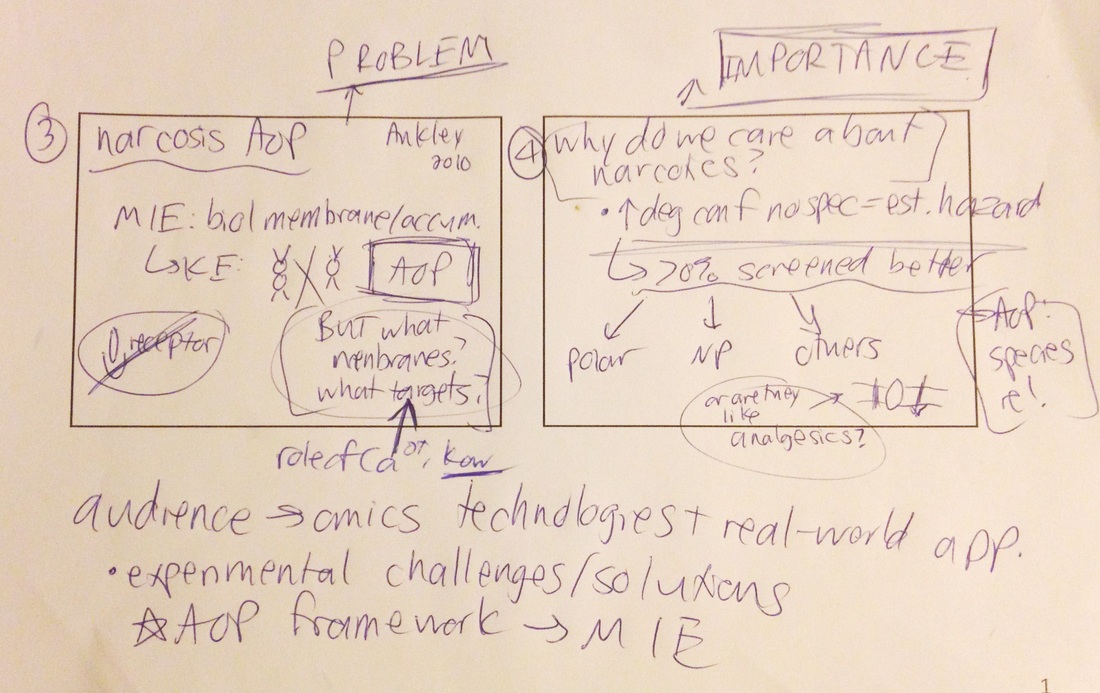
So now that I've put everyone on the same page about what narcosis is, I'll then present the specific problem I'm looking into, in this case the lack of understanding of the molecular mechanism of toxicity. This will be in the context of work done by senior scientists who will most likely be in the audience, so I've made a note to cite their work. This brings in concepts that I discussed in more detail in Step 1 of the perfect** presentation, where you get people's attention by describing a problem in your field, why that problem is important, and then in the next slides how you solve it. For this talk I present the problem and then talk about how knowing mechanisms of toxicity are relevant for accurate risk assessments for chemicals, especially narcotics. Hook, line, and sinker!
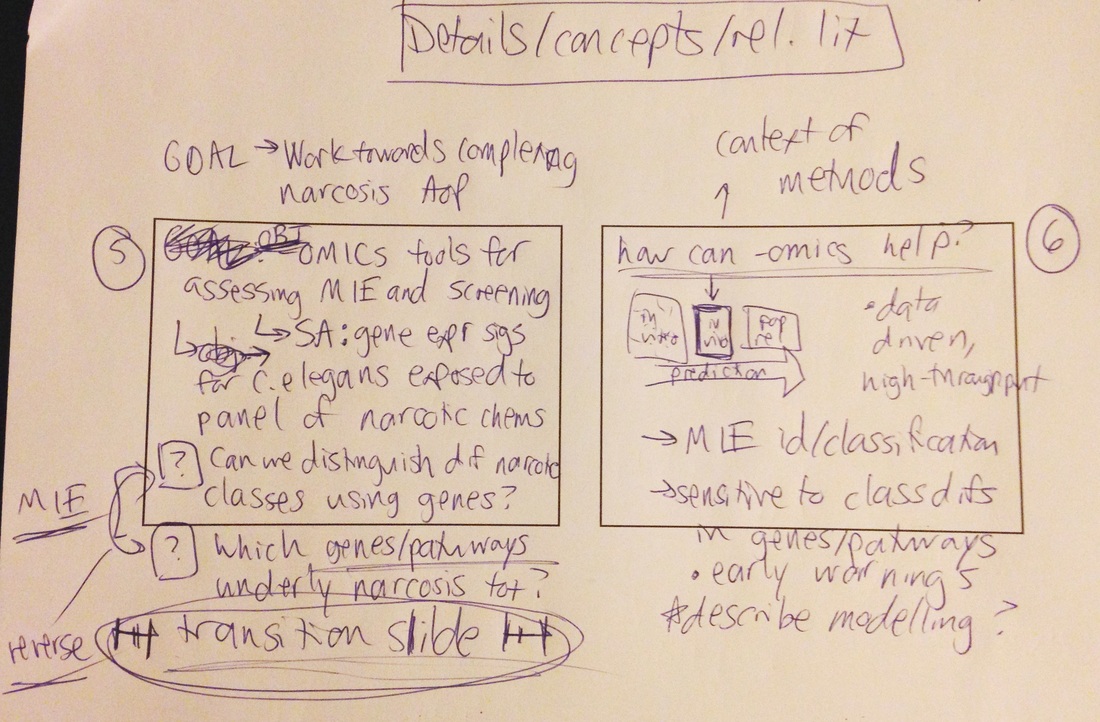
At this point I've now laid out the objective of my project, the specific questions I'm asking, and how they will address the issues I presented in the introduction. This slide (#5) also comes at a time where I am transitioning between background information and getting into the nitty gritty of my project. You can skip trying to decipher my bad handwriting and read more about Step 2 and how you present setting out to solve the problem you just talked about.
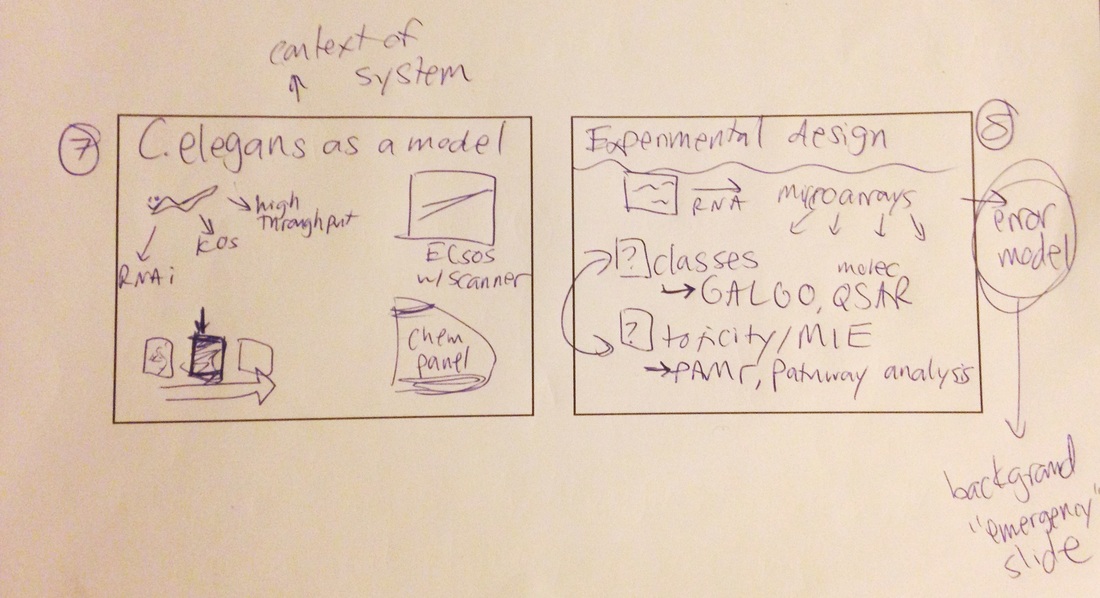
After the transition slide and describing my project's objective and questions, I then go into a bit more background information to provide context for the data which I'll show next. This includes one slide (#6, see panel above) on how high-throughput molecular techniques can help address these questions, and one slide (#7) on my model system and why we chose it, including background information of toxicity of narcotics in my model system. I then give a schematic of my experimental design and will talk here about the analytical methods I'll be presenting. I also made a note to myself to make an 'emergency' slide with details of one of the methods of my project. As its only a small part of what I'm doing but something that a few people might question, I'll make a slide to have at the end in case I get a question after the main part of the talk.
So with those eight slides I'm now 2/3 done with my talk. The last four slides will be data and conclusions, and to prevent any earth-shattering findings from escaping into The Internet too soon (and to motivate any SETAC meeting attendees to actually come to my talk, on the last day of the conference in the late afternoon!), I'll save those sketches for when I make the real thing. Step 1. Set the stage and Step 2. The Hook To give you a sense for how the introduction slides actually ended up looking, apart from my terrible scribbling, here are how they turned out so far. I added animations in the actual presentation so the content doesn't all come up at once, which also allows what I say and the components of each slide to come together in a more logical progression. As an aside, I have no idea the appropriate color for biological membranes, so I am currently thinking of new ways to see if I can make a bipolar membrane not look like blueberry lollipops. To be determined for the next blog post.
As you can see, there's a lot you can convey with lollipops and arrows, and remember that at the same time that your slides will be on screen you'll also be speaking (as scary of a concept as that seems). Think about how your words and your slides can work together, and keep to a minimum any redundant or unnecessary text as well as figures or diagrams that may be too detailed or too small to see or understand clearly. Before jet-setting off into your experimental design, take a slide to transition from introduction to experimentation while at the same time giving your audience a clear vision of what you are doing and what scientific questions you are answering (e.g. the hook).
While I've touched briefly on some of the last three steps while working on my storyboard (the story, take a bow, and break a leg), we'll save a more in-depth analysis of these for when we get closer to the actual meeting. It will also give me a chance to finish making my data slides, and to practice my talk before giving the real thing to a live, scientific audience, including but not limited to collaborators, experts in the field, and potential future employers. Again, no pressure. Until next time, happy storyboarding! Comments are closed.
|
Archives
August 2018
Categories
All
|
Addtext

 RSS Feed